
OpenStack Lab Overview
Welcome to OneCloud’s OpenStack Bootcamp lab. You will be accessing a remote lab environment that is either running two Ubuntu or CentOS-based virtual machines, which you will configure over the course of this lab to create your first OpenStack system. This “two node” setup is the simplest scalable implementation of OpenStack. You will primarily be configuring a control node that we refer to as the “all-in-one” or aio node. In lab 5, after configuring the OpenStack networking service, neutron, you will also configure a second “compute” node that will allow you to configure networks between your aio and compute nodes. The lab environment you will be creating is shown below.
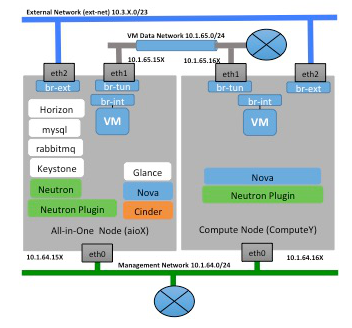
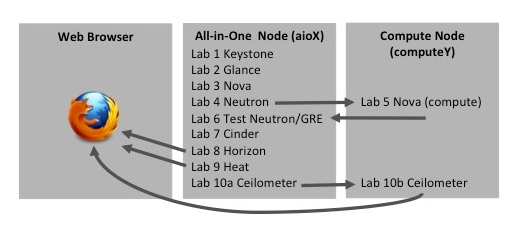
Note that you will be moving between aio and compute nodes and then your web browser as you move through the labs. You may wish to reference the graphic below as a guide.
Lab Access
Your instructor will provide you with a User group assignment prior to starting the lab. If you have not already logged in, you will find the credentials you will need to access you specific lab environment here: Class IP Assignments
and instructions to access the environment are here: Bootcamp Lab Access
Before you begin: How to debug issues in OpenStack
Part of the learning process and the reality of working with OpenStack is that problems do arise that require troubleshooting – and use of the command line. Here we provide strategy and guidance about how to figure out where the problem might be.
screen:
screen is a useful tool as it allows you to have multiple “views” in a single terminal window, and lets you switch between them with a keystroke rather than opening multiple windows and point/clicking between them. in addition, screen can log the output of a terminal session to disk, making it useful for capturing the output of failures for later review.
Start screen and log the output: screen –L
Once started, you can create a new screen with: -a c Which is hold the control key, and press a, release the control and a, and the press c
Move between the screens with -a
Screen does live within a single “view” of the terminal, so to look at the scrollback buffer, you have to -a And then use the arrow keys on your keyboard to scroll up (-b scrolls back a page, -f scrolls forward)
Get help for screen (many more capabilities): -a ?
log files:
There are numerous log files per service, and often the error will be exposed in the log file output. Each project will have a log directory in /var/log/{service} (for example /var/log/glance will have the log files for glance). Since services have different components that operate in similar but not always equivalent fashion, it’s best to use screen to open a session per log file so you can watch the entire set of possible outputs to find the system that isn’t responding appropriately. You can follow the logs with the “tail” command such as:
tail -f /var/log/{service}/{service}-api.logWhen you are done following the file, you can exit out with:
<ctrl>-c· Logging may be low level, look at .conf file (/etc/{service}/*conf), turn on verbose and debug options. (e.g. etc/glance/glance.conf) · Restart services if changing logging levels
Now that we know how to watch the logs and can see what’s going on, we can try to spot the errors both in the .conf file (just by reviewing the actual lines typed in).
Usual issues are that AMQP isn’t connected and eventually quits trying to connect (usually in the API log). The same is true for mySQL mis-configurations. If an error is found it’s best to restart all of the services in that project group (e.g. the entire nova processes) in case there’s a non-obvious interaction with Rabbit or mySQL buried in the application components themselves.
You can check through the following configurations in /etc/{service}/{service}.conf
- the keystone API URI/URL components and port.
- the hostname provided for all the different services
- check target URI/URL components in .conf file
- validate endpoint in keystone. You can do this via the {service} cli tool.
glance --debug image-listShould have an output something like:
$ glance --debug image-list
curl -i -X GET -H 'Accept-Encoding: gzip, deflate' -H 'Accept: */*' -H 'User-Agent: python-glanceclient' -H 'Connection: keep-alive' -H 'X-Auth-Token: {SHA1}73459d07b6cf38f67503dc2ec9090c48c479c8b7' -H 'Content-Type: application/octet-stream' http://c240-1.onecloud:9292/v1/images/detail?sort_key=name&sort_dir=asc&limit=20
REST Commands
The cli with –debug also prints out the correctly focused REST calls (with curl as the application already even) that you can generally pasted into your console to see what’s happening.
Rapidly restarting services
If you need to restart all of the nova or neutron services, you can do so quickly on Ubuntu as follows:
for name in `(cd /etc/init; ls *{service}’ | cut -d. -f1)`; do service ${name} restart; done